Tracking a home’s power use, circuit by circuit
A study: what each circuit consumes, measured from outside.
Knowing what each circuit of a house consumes, item by item, without opening the electrical panel or taking anything apart: you open the door, glue a small coil on the face of each breaker, where the current’s magnetic field concentrates, and a Raspberry Pi recovers each circuit’s current and power, untangles what each coil picks up from its neighbours, and refines its settings by itself at every appliance that switches on or off.
It is a study, from the principle to the wiring, in 25 plates drawn in the order of the job: understand, map a breaker before building anything, build the electronics, install the strips, calibrate, then let the learning work. A second version: the first set the coils on the panel’s door, too far from the current.
Nothing is built yet, and many values remain the model’s estimates, to be checked by measurement on a real panel.
The result
What was done
01
The field model
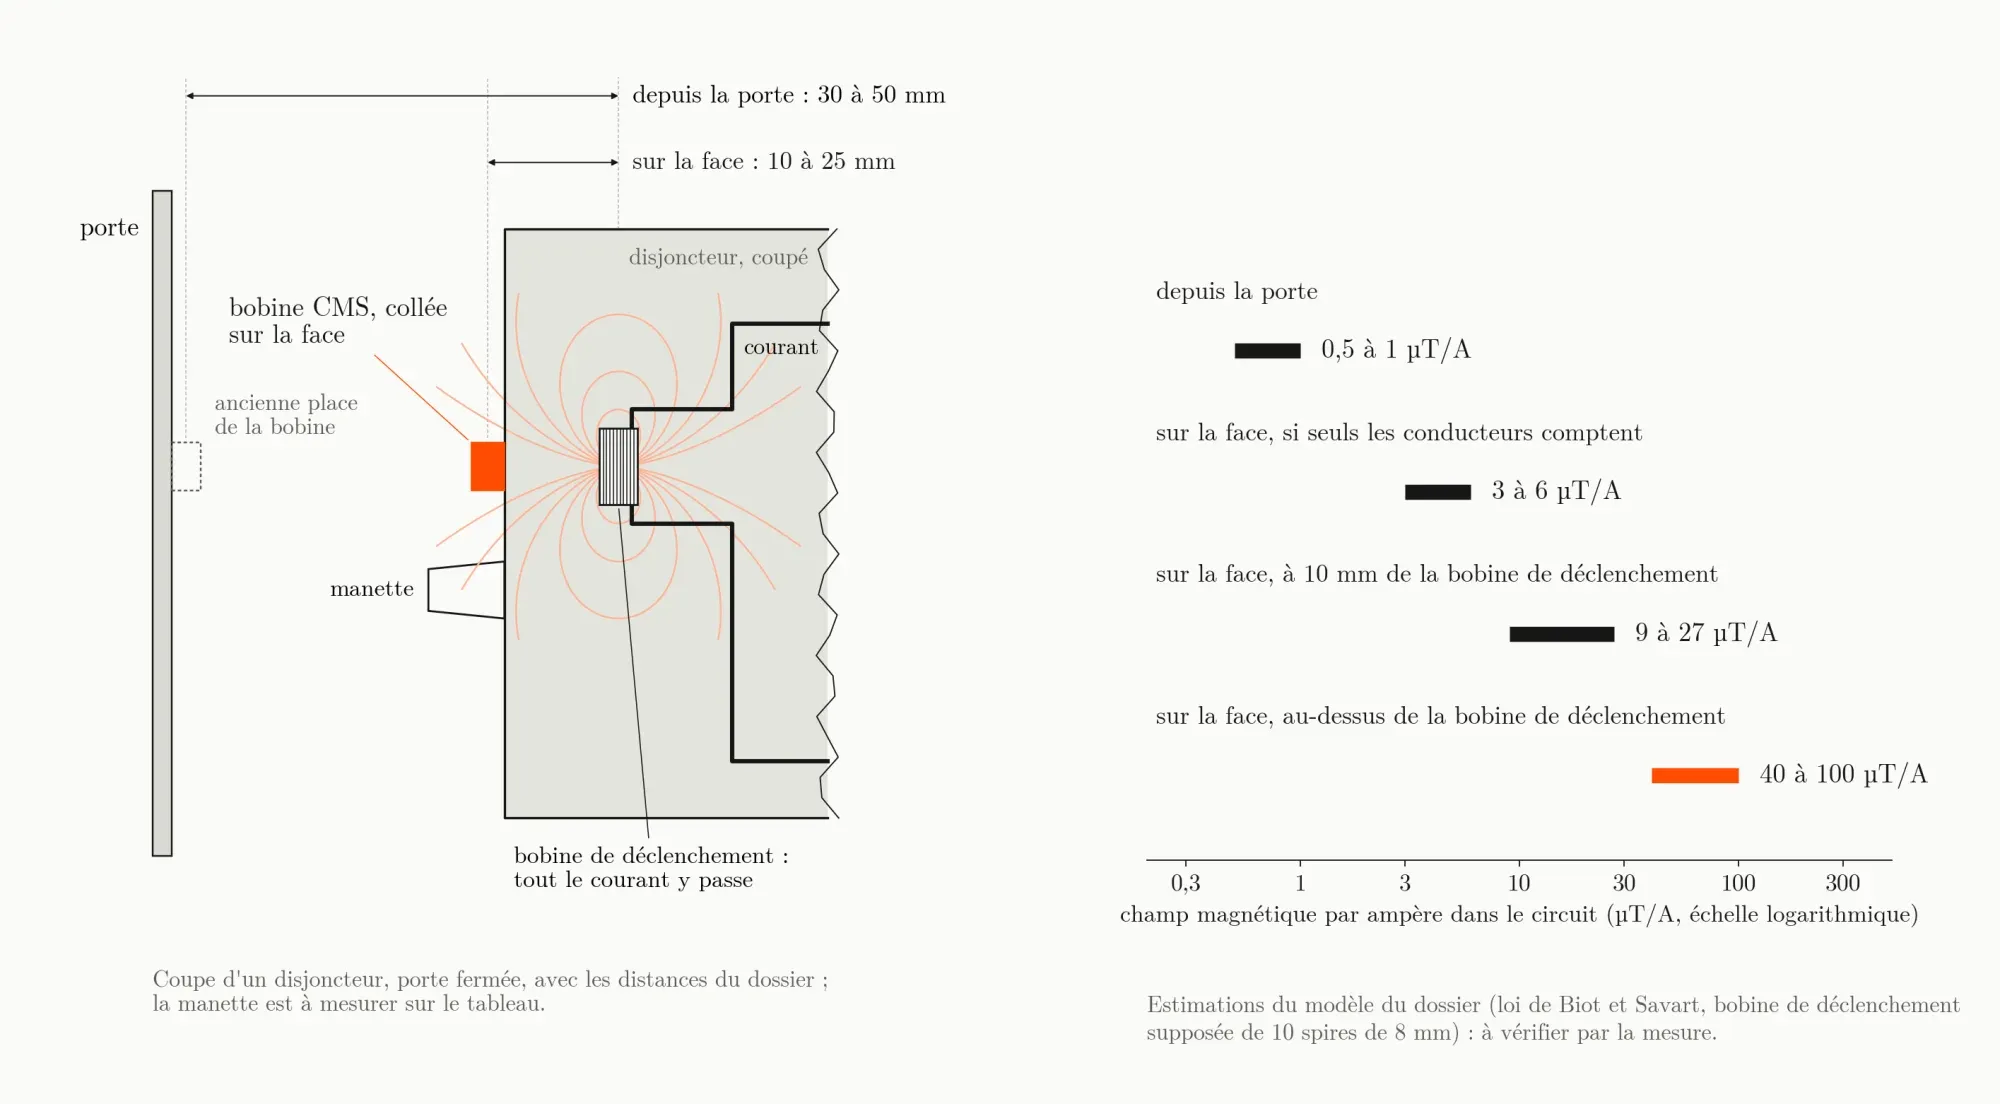
The magnetic field around each breaker, computed for conductors of finite length, at each possible position of the coil, and what each neighbour adds to it: enough to choose where to glue.
Biot–Savart law
02
The measurement chain
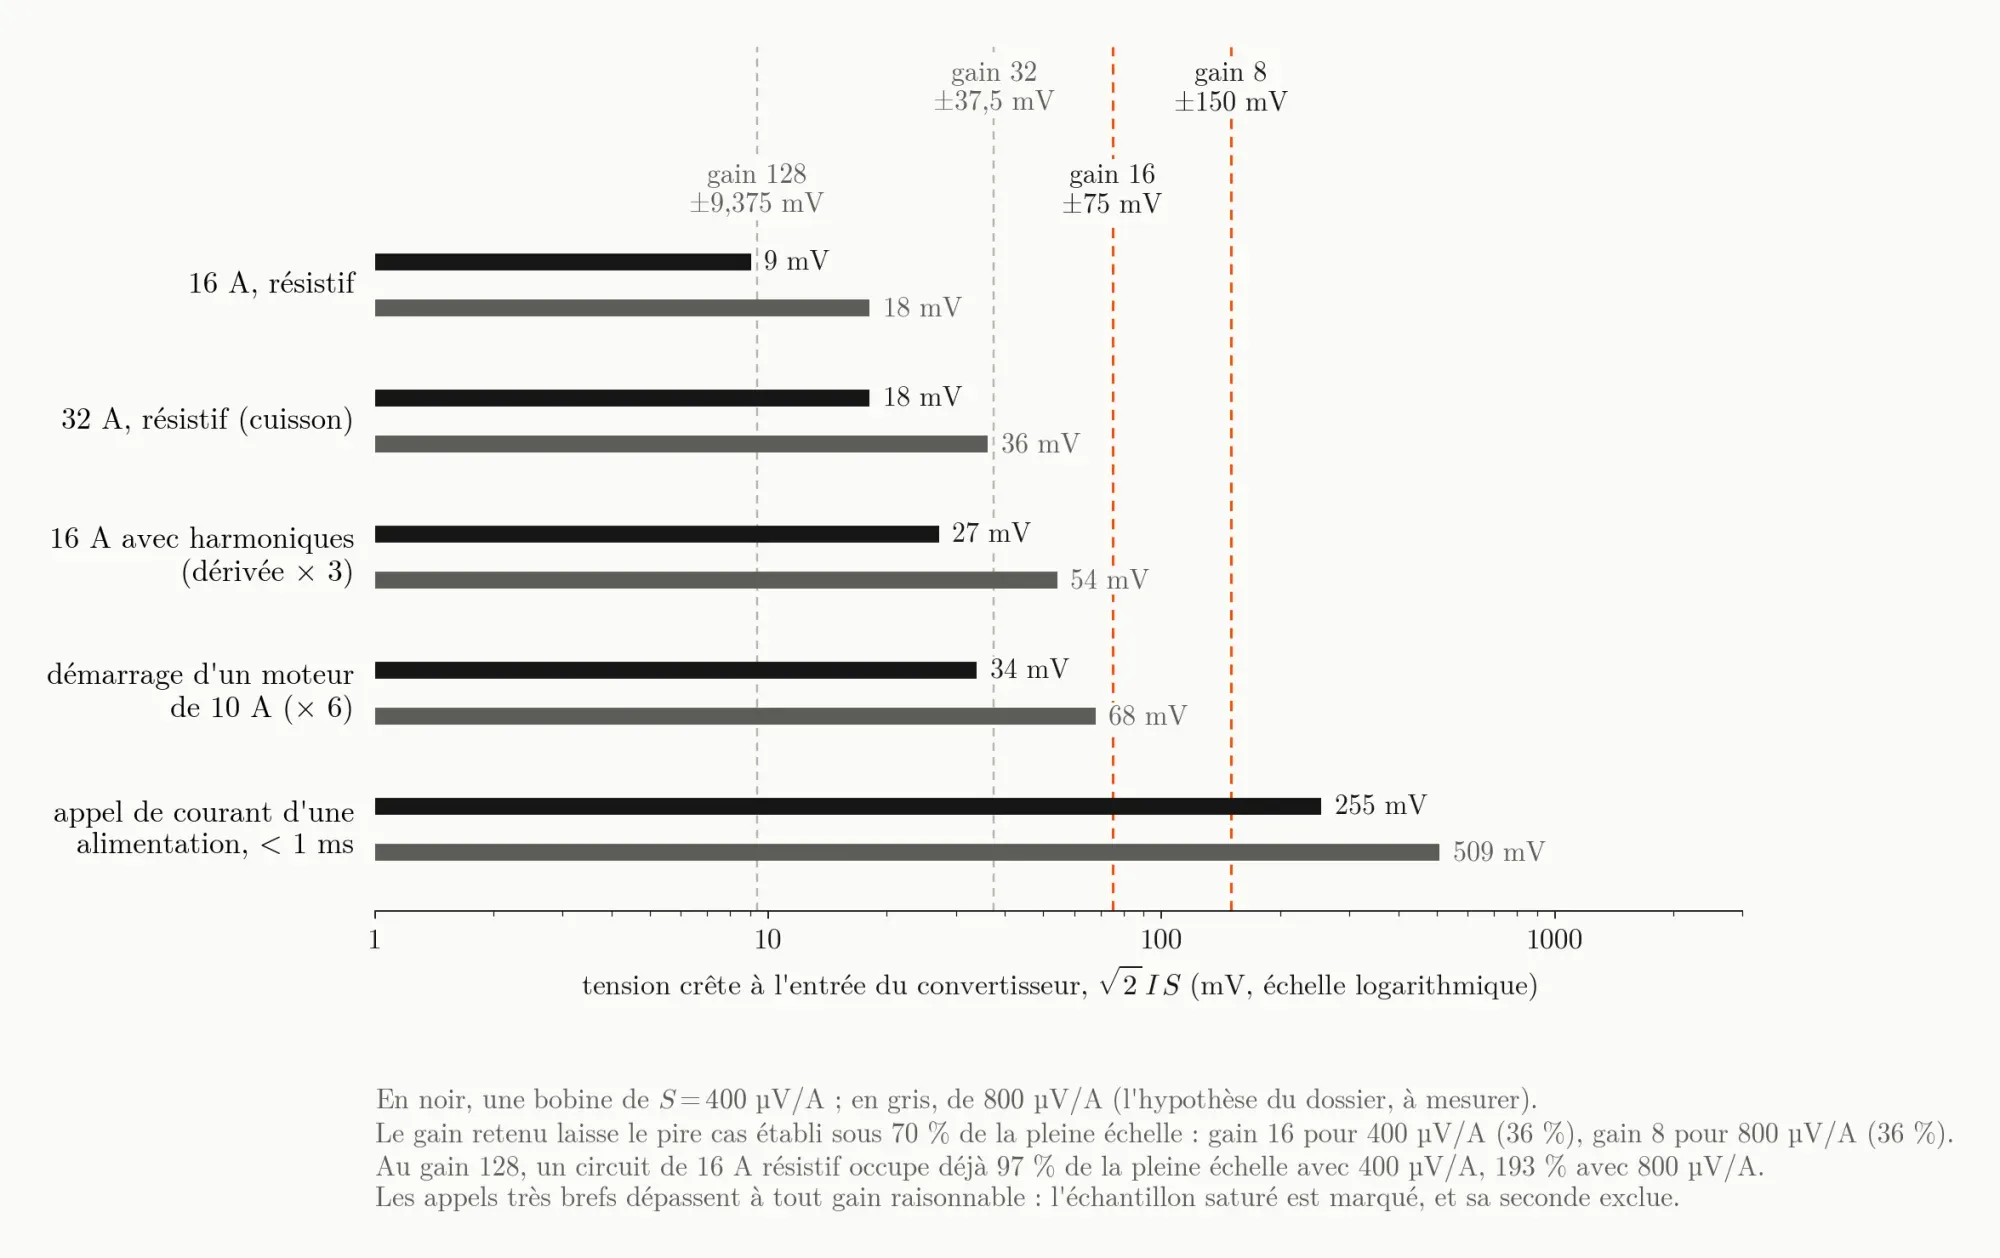
The flat coil chosen, one filter per channel, four eight-channel converters with the gain chosen channel by channel, the isolated voltage channel, and the microcontroller that paces and reads them.
SMD coils · 4 × ADS131M08 · Raspberry Pi Pico 2
03
The strips
One polycarbonate band per row, with a window per coil at the breakers’ pitch, twisted pairs laid on the band, a flat ribbon thin enough to pass with the door closed, and a tape that stands the heat.
Kapton
04
The software
The un-mixing of the signals sample by sample, the phasors computed every second, the detection of a jump between two plateaus, the phase test, the assignment to the right circuit, the update by median and its confidence; the power per circuit kept.
Raspberry Pi · SQLite
05
The dossier
Twenty-five drawn plates, in the order of the job, with the shopping list, the safety rules and the list of what remains to be measured on a real panel.
SVG
How it works
Scroll: the drawing follows.
01 / 07
A coil on each breaker, door open
To know what each circuit of a house consumes, one usually sets a sensor on each cable, cover off. Here the sensors stick to the face of the breakers, where their toggle sticks out: you open the panel’s door, and nothing more. One flat five-millimetre coil per breaker, 27, and one per residual-current device, 3.
02 / 07
The current makes a field, the field makes a voltage
A current flowing through a wire creates a magnetic field around it, proportional to that current. A coil placed in that field sees a voltage appear across it: that is magnetic induction. Glued right above the breaker’s trip coil, a few turns that the whole current of the circuit passes through, it picks up a field a hundred times stronger than from the door, by the model.
03 / 07
Find the right spot on each breaker
Each brand puts its trip coil somewhere else. Before building, one hour per model: a coil held with tape, a known load, a multimeter to find the spot where the signal is strongest, then a sound card to measure what the coil picks up from the neighbouring circuits. This survey fixes each coil’s position, orientation and gain.
04 / 07
Thirty signals, read together
The coils sit in one strip per row, held with Kapton tape between the devices, never on a toggle. Their wires leave as a ribbon to a wall box: one filter per channel, four eight-channel converters that digitise everything at the same time, and a Raspberry Pi Pico 2 that paces it all. A small transformer, kept thirty centimetres away, gives the mains voltage.
05 / 07
From the coil’s signal to the current, then the power
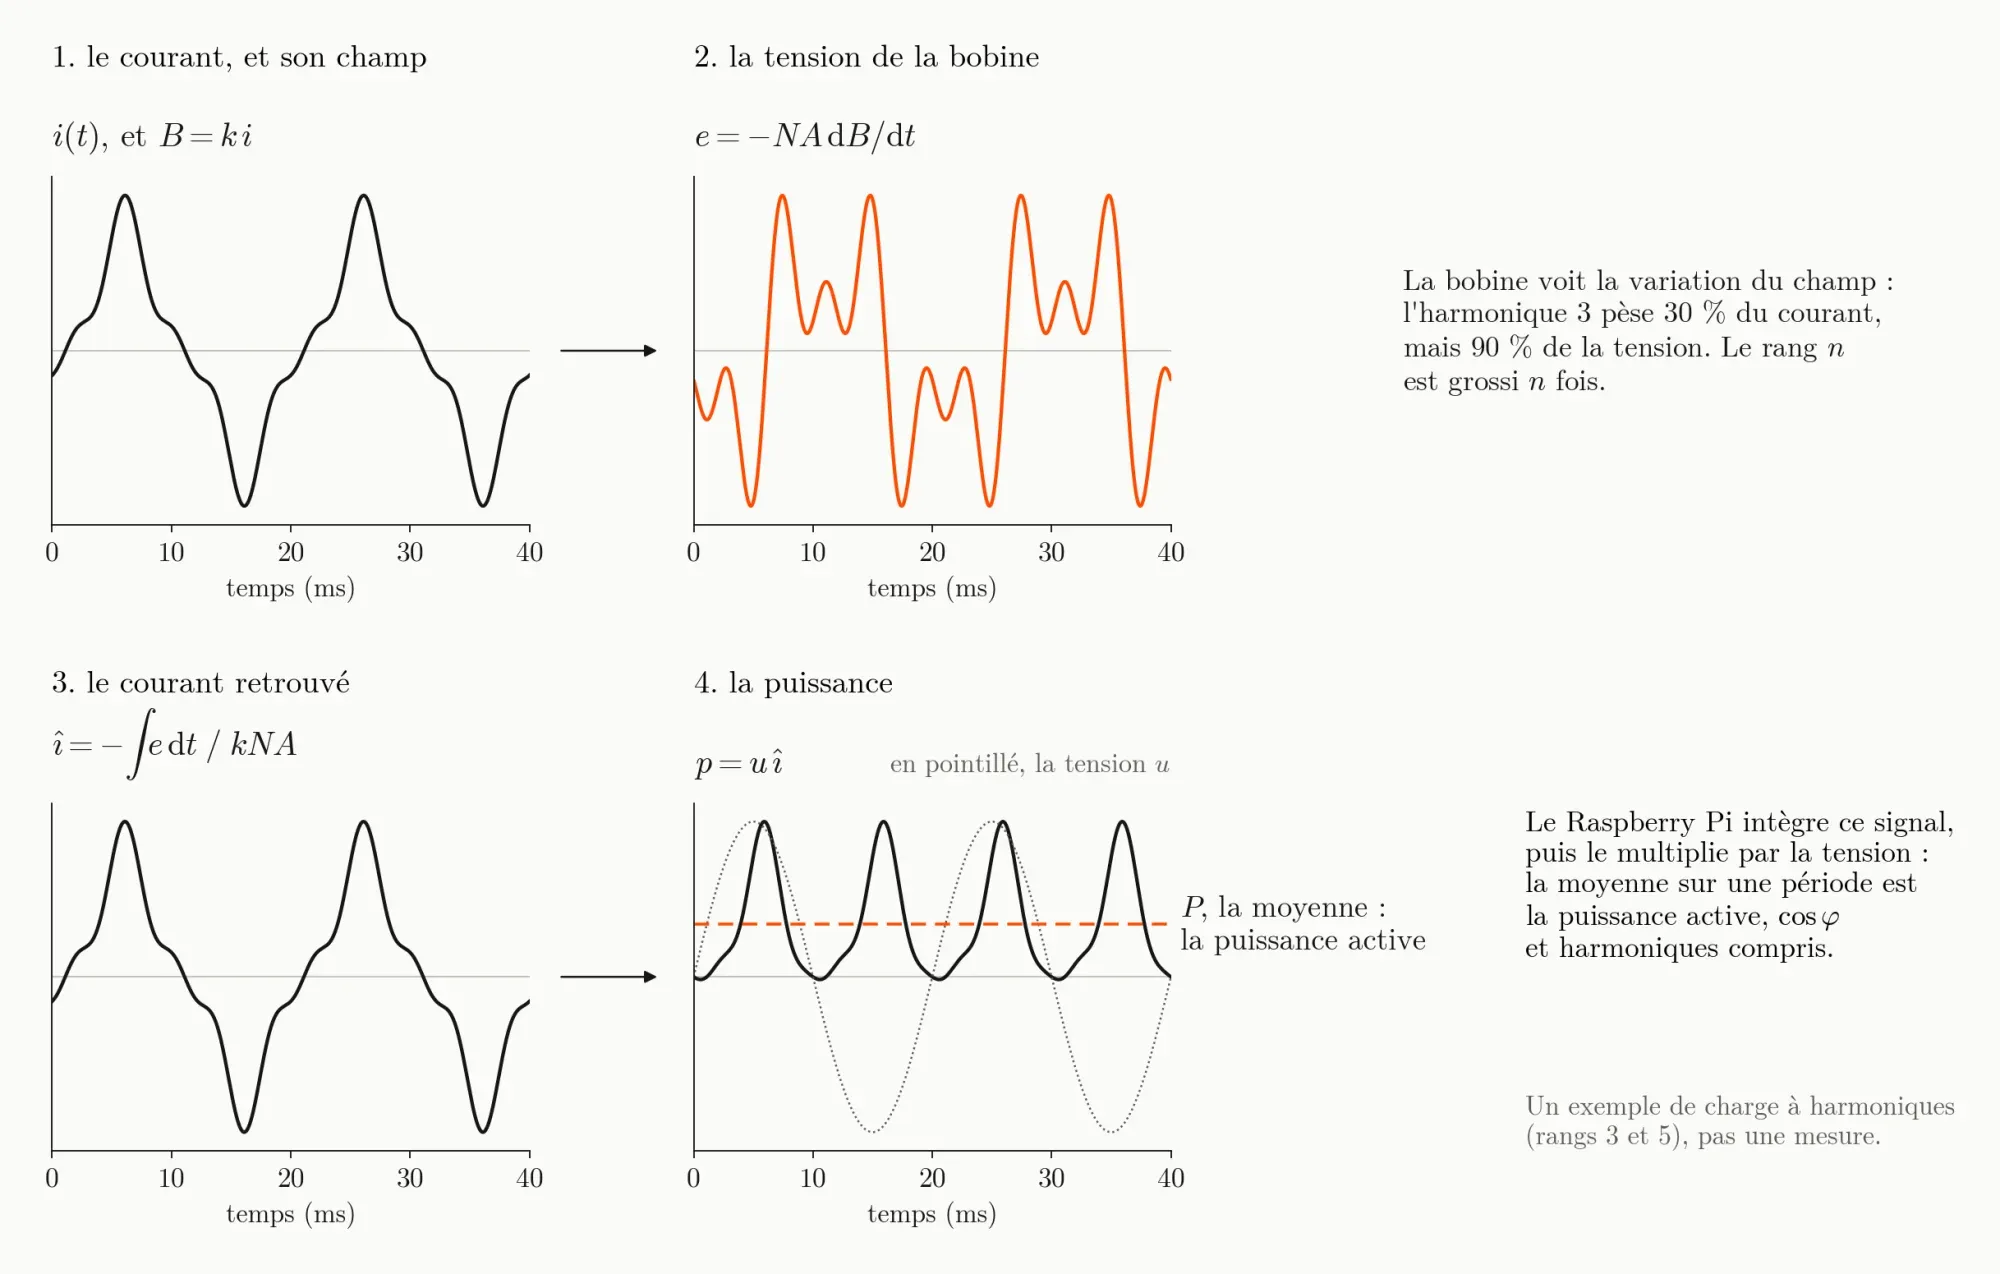
The coil does not measure the field but its variation: its signal is the derivative of the current. A Raspberry Pi integrates it to recover the exact shape of the current, harmonics included, multiplies it by the voltage, and the average over one period gives the power really consumed, phase shift included. Circuit by circuit, over time.
06 / 07
Each coil hears its neighbours too
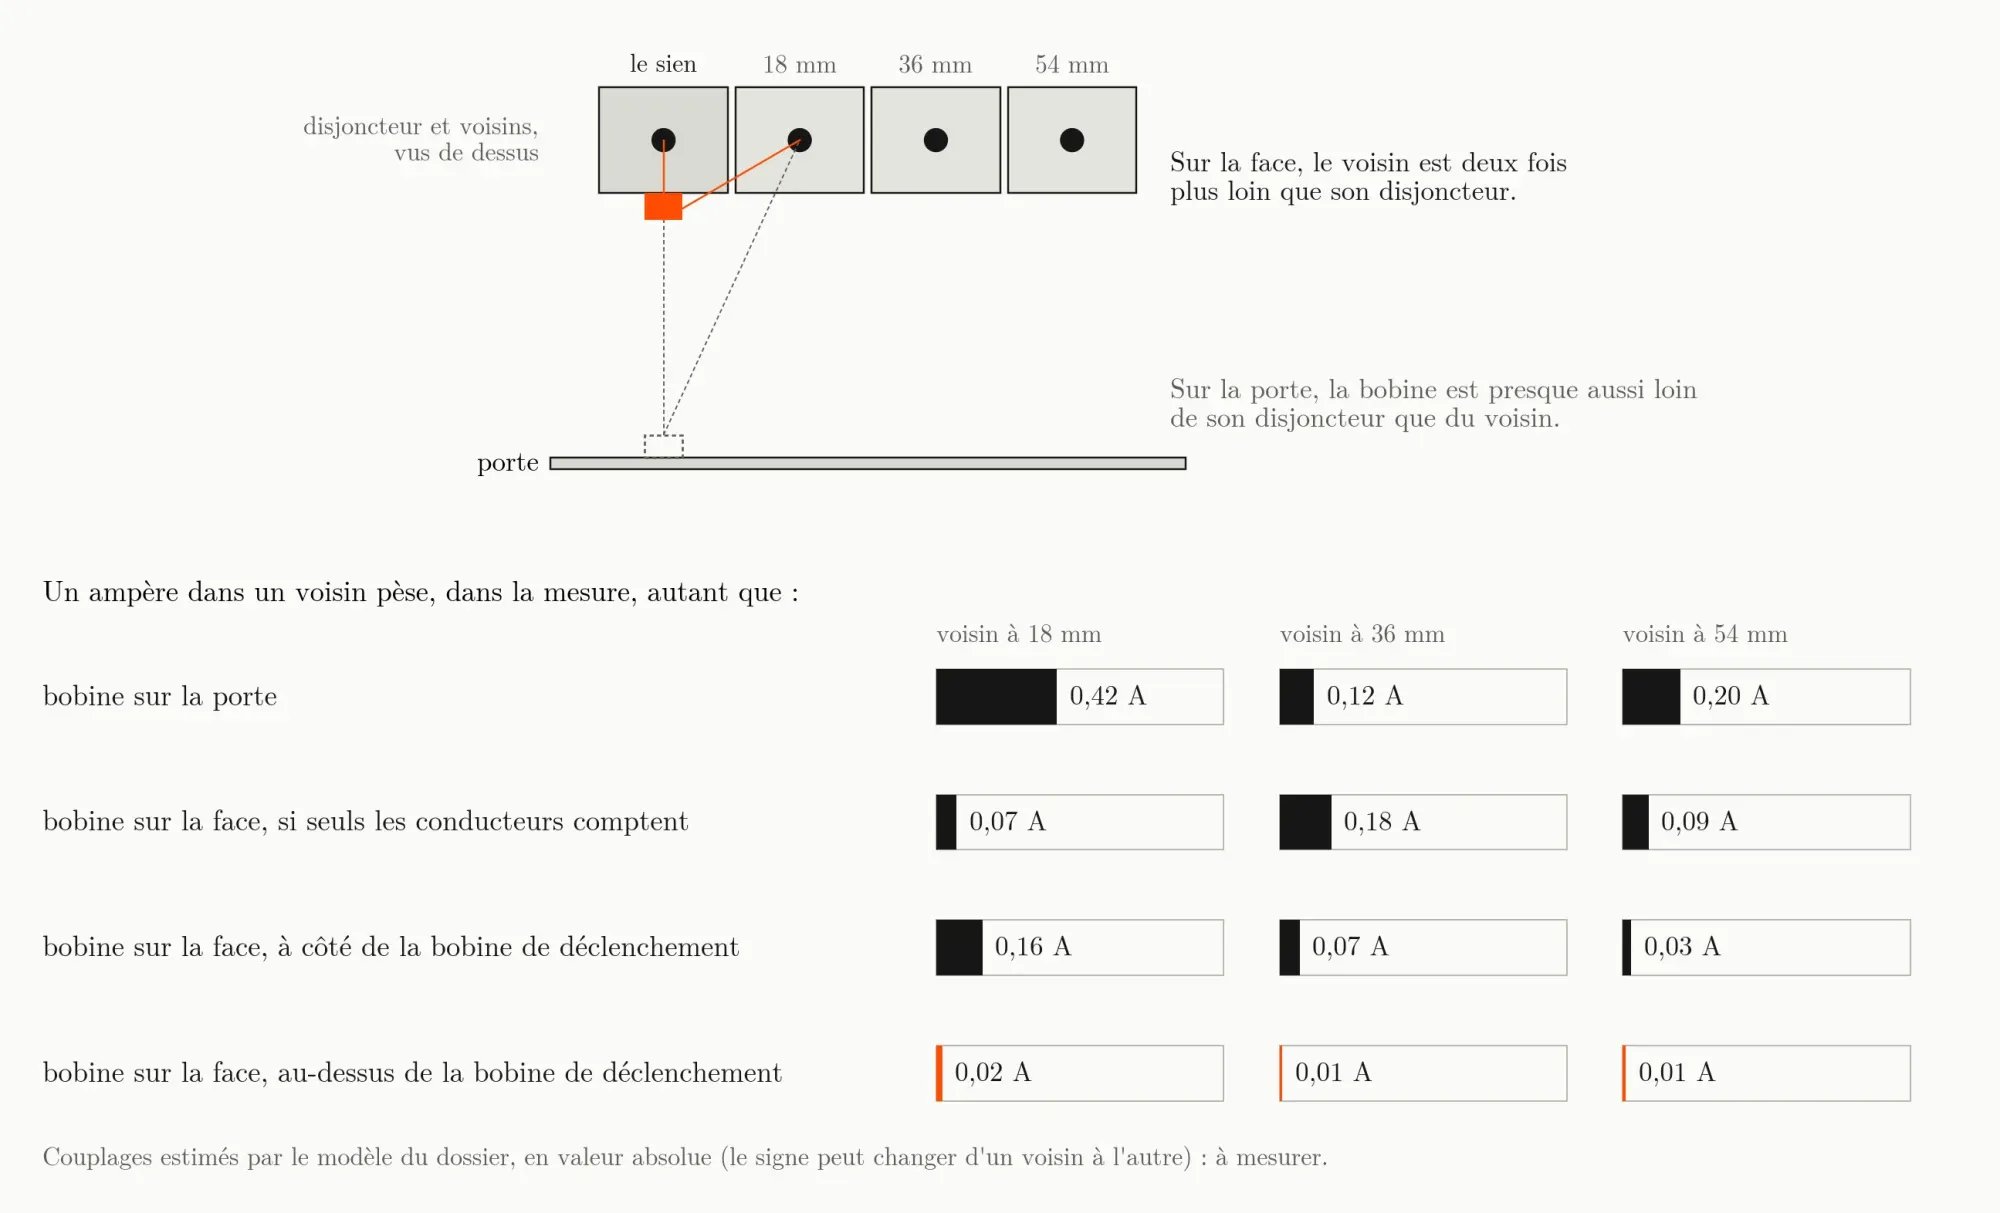
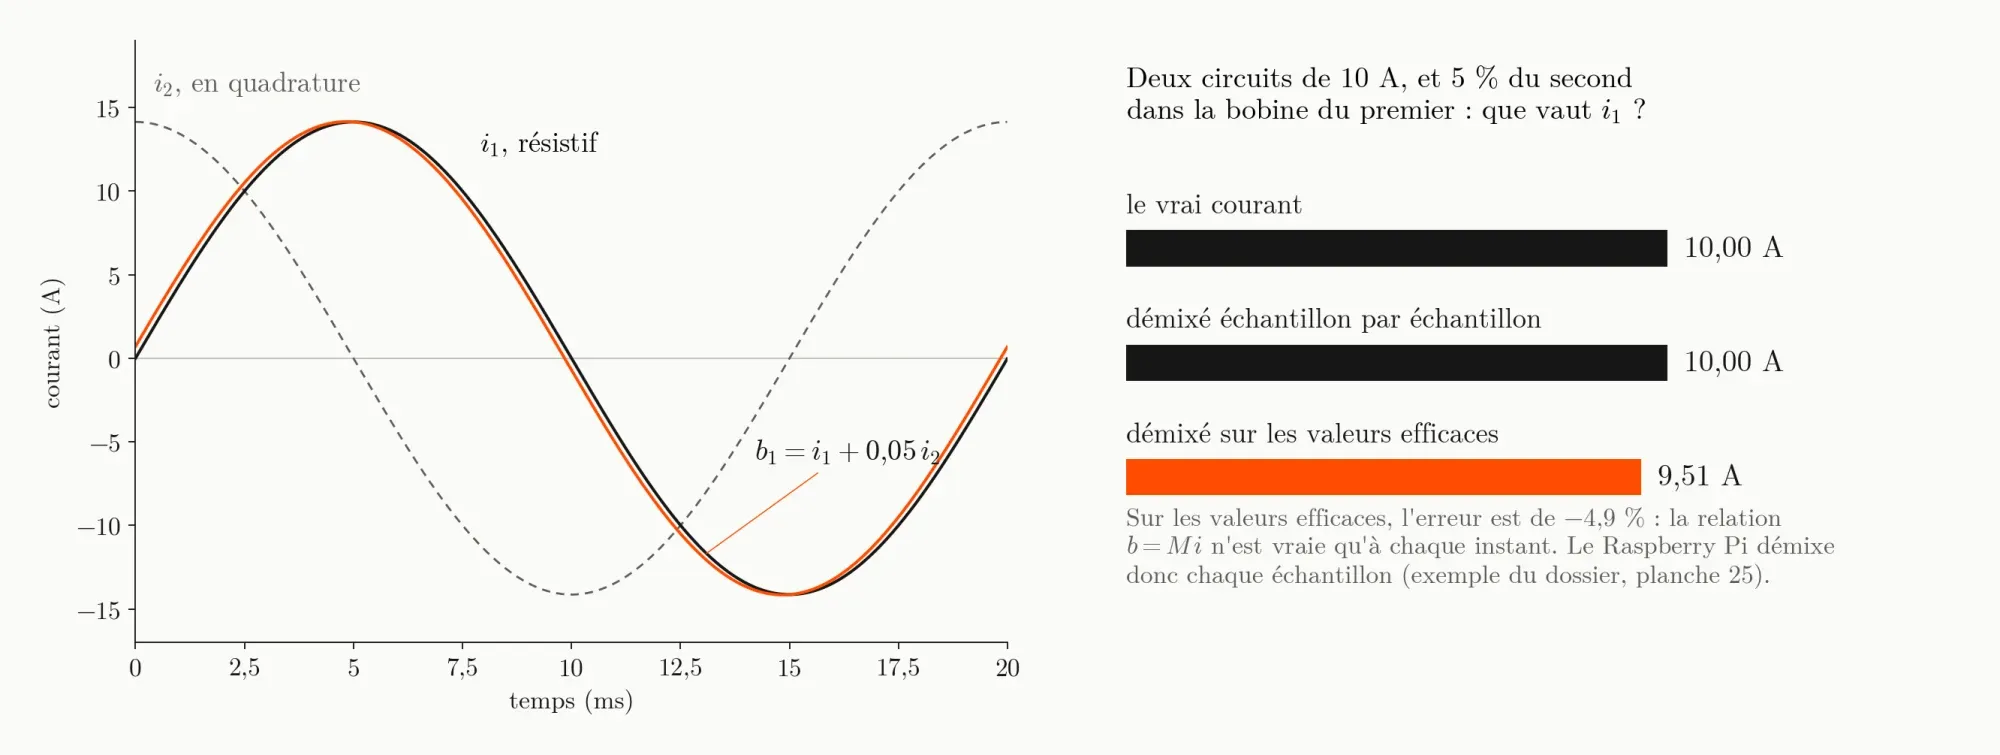
A breaker’s field spills onto the coils next to it, a few percent. The Pi untangles the 27 signals at every sample with a matrix that says how much each circuit weighs on each coil. The three coils on the residual-current devices serve as a check: the sum of a row’s circuits must equal its device’s current.
07 / 07
The panel calibrates itself
At the start, one known load per circuit sets each one’s scale. Then every appliance that starts or stops is a small experiment: one circuit jumps, the others stay still. The Pi spots that jump, checks that it is clean, assigns it to the right circuit and refines its column of the matrix, by the median of the last thirty jumps. Nothing is built yet: it is a study of 25 plates, whose values remain to be measured on a real panel.
Specifications
- Built with
- SMD coils · 4 × ADS131M08 · Raspberry Pi Pico 2 · Raspberry Pi · SQLite
- Scale
- 30 circuits · 25 plates
- Status
- study